Overview
DynamoEval and DynamoGuard are two powerful products from Dynamo AI that help enterprises with AI evaluations and guardrailing, respectively. When used, these products generate valuable data that require a robust monitoring and visualization solution to be effective.
Dynamo AI offers both internal solutions for these, as well as a way for customers to integrate with their third party monitoring and visualization solutions of choice. These tools often vary between DynamoEval and DynamoGuard due to differences in use cases -
DynamoEval produces data in batches, after each evaluation. This data includes several metrics, insights for improvement, and the datapoints that were evaluated. How often these evaluations are run is a customer choice. Two key use cases after evaluations are analytics and visualization of the evaluation results, and cataloging of evaluations and monitoring of trends in a time window set by the customer. For these use cases, customers prefer solutions like Weights & Biases and PowerBI which are geared towards historical data analysis.
DynamoGuard produces data in real time. Every time it makes an assessment, it creates a data point containing the following information -
| Metadata | Details |
|---|---|
| Timestamp | The time this datapoint was generated. |
| Input | Input that is being evaluated as compliant or not. |
| Input Type | Whether the input is user prompt or model response. |
| Action | Whether an action was taken based on the assessment - FLAG and BLOCK are two common actions. |
| Applied Policies (AP) | Multiple policies can be applied to a single model, therefore outcome can depend on the assessment of one or more policies. Each metadata and value has to stay associated with the policy they belong to. Say 2 policies are applied, there will be two sets of the AP: subfields captured below. |
| AP: Policy Id | Unique identifier of the Policy being applied. |
| AP: Policy Type | Often applications have several policy types |
| AP: Applicable To | Whether this policy is applicable to user inputs or model responses. |
| AP: Creator Id | The user that created the Policy |
| AP: Name | Name of the policy |
| AP: Description | Policy description (this can be omitted in high volume applications) |
| AP: Action | Whether an action should be taken based on this assessment |
| AP: Parameters | The parameters needed for the policy assessment to be made, like metrics to be calculated or thresholds. |
| AP: Outcomes | Outcome of each assessment, should map the Assessment Params field above. |
| AP: Violation? | Whether the input was in violation of the policy. |
Customers then can use this data in two different ways -
- Real-time monitoring and insights - including alerts and case management over adversary and anomalous behavior.
- Historical and ad hoc analysis for longer term trends and efficacy evaluations where guard assessments are compared to human expert judgments.
Because of the differences in use cases and data generated, Dynamo AI offers different integration paths to customers.The sections below details these separately.
DynamoEval Integration Path
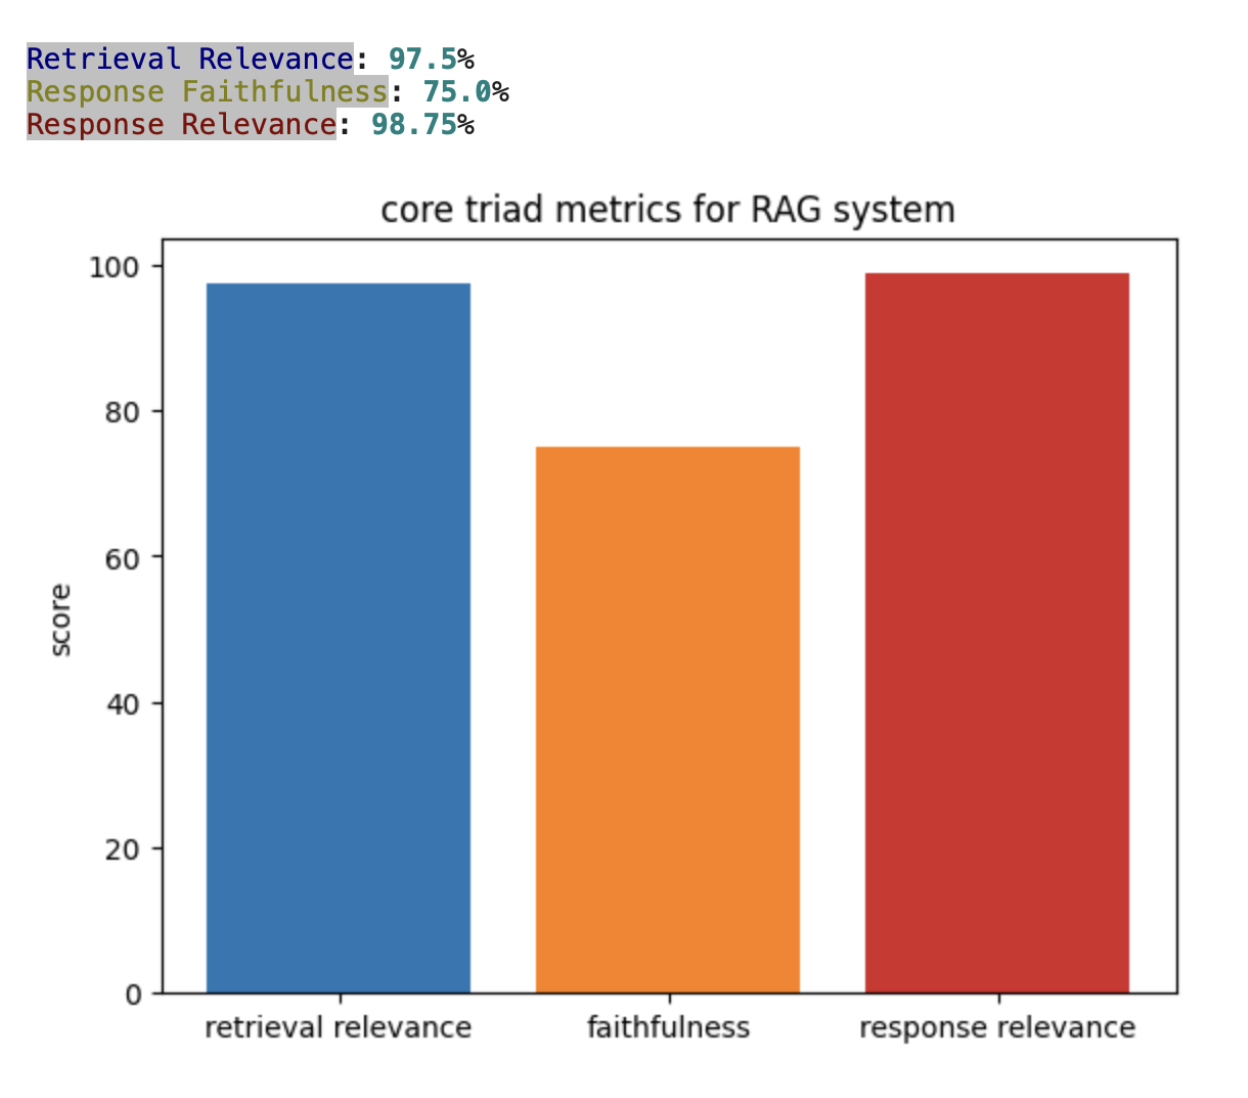
Customers can engage with DynamoEval both through an app, as well as through the SDK which can be accessed through the notebook of their choice. The App path currently does not offer 3P integrations, as it provides its own monitoring & visualization solution. The SDK path on the other hand, is more popular among customers and is very flexible in how monitoring & visualization is going to happen. Once an evaluation is run through the SDK, the customer has the outcomes in some form of data structure - often Pandas DataFrame for tables and floats for metrics. Below is an example of how a customer can generate a simple chart using nothing but a python library.
    import matplotlib.pyplot as plt

    print("[blue on white]Retrieval Relevance[/]: " +
    str(retrieval_relevance_percentage) + "%")
    print("[yellow on white]Response Faithfulness[/]: " +
    str(response_faithfulness_percentage) + "%")
    print("[red on white]Response Relevance[/]: " +
    str(response_relevance_percentage) + "%")
    print("\n")

    fig, ax = plt.subplots()

    metrics = ['retrieval relevance', 'faithfulness', 'response relevance']
    percentages = [retrieval_relevance_percentage,
    response_faithfulness_percentage, response_relevance_percentage]
    bar_colors = ['tab:blue', 'tab:orange', 'tab:red']

    ax.bar(metrics, percentages, color=bar_colors)

    ax.set_ylabel('score')
    ax.set_title('core triad metrics for RAG system')

    plt.show()
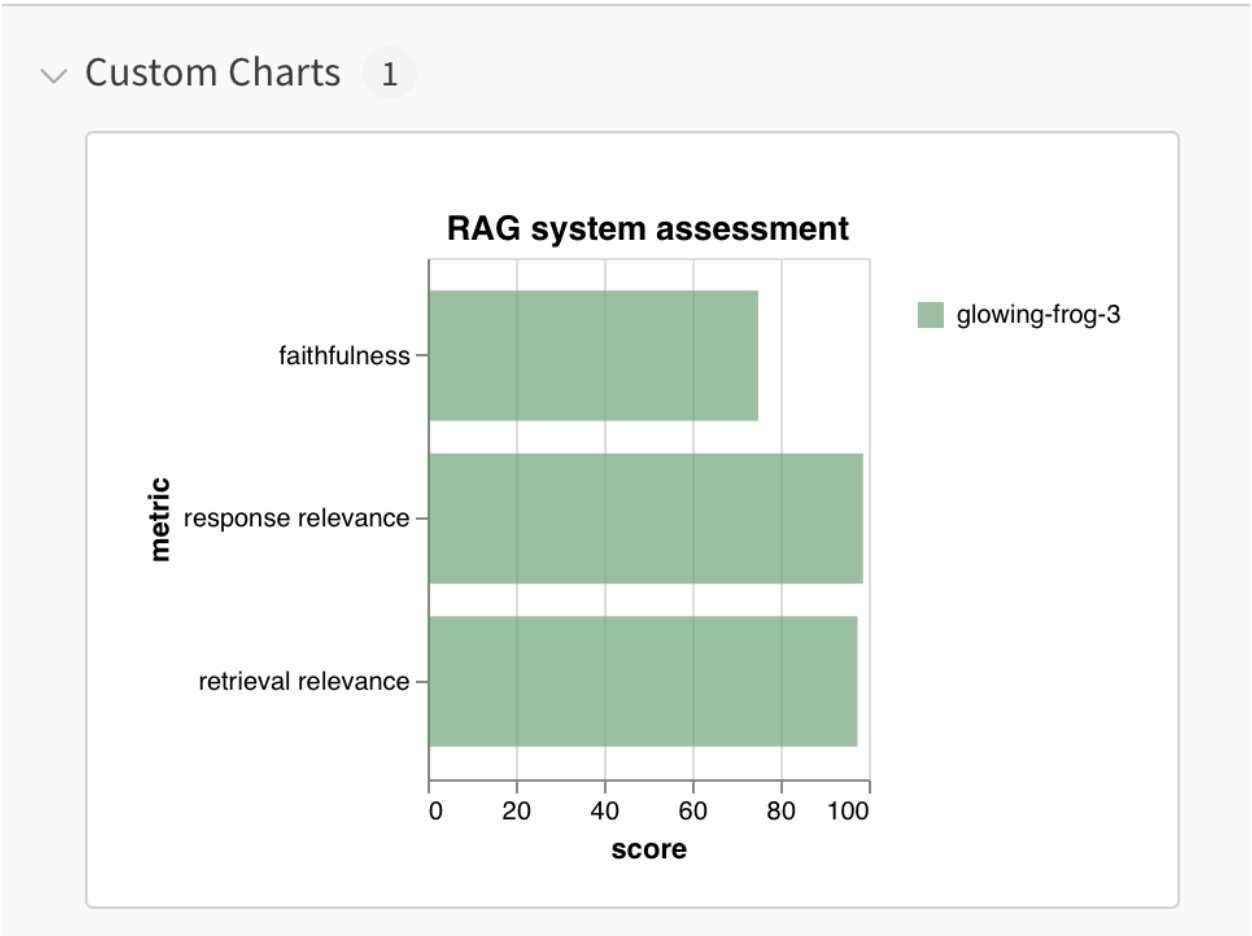
The same data can be published to any other third party solution, like Weights & Balance and PowerBI, in a very similar way leveraging their SDKs after installing them. The example below is with Weights & Biases -
    import wandb

    wandb.login()

    chart_data = []
    index = 0

    for metric in metrics:
     score = percentages[index]
     chart_data.append([metric, score])
     index+=1

    print(chart_data)

    metrics_table = wandb.Table(data=chart_data, columns=["metric", "score"])

    wandb.init(project="RAG system core triad metrics")
    wandb.log({"RAG metrics": metrics_table})

    bar_plot = wandb.plot.bar(
       metrics_table,
       label="metric",
       value="score",
       title="RAG system assessment")

    wandb.log({"RAG metrics": bar_plot}, step=1)

    wandb.finish()
This code block automatically uploads desired data to Weights & Biases’ servers, which is retained there for the customer to analyze anytime. Customers can create custom charts and publish new runs in the same workspace to compare model performance. While the path shown here is ad-hoc, these can be automated by customers’ evaluation workflows using DynamoEval and 3P provider SDKs.
DynamoGuard 3P Integration Path
As described in the overview section, DynamoGuard Monitoring & Visualization has to support both real-time and historical data for two different use cases. This makes DynamoGuard integrations more complex due to the added real-time requirements. But equally importantly, customers almost always want to use real-time data generated by DynamoGuard in a much broader way than is often implied with Monitoring & Visualization. They want to treat it as a core datastream in their AI Workflows, powering other real-time scenarios over there. A good example here is security risk identification and case management, with custom logic on when these should be triggered, using their tools of choice. While designing DynamoGuard 3P integrations, we had to take all of these in as requirements to design an ideal integration point for simplicity, cost and downstream consistency purposes.
For batch, historical scenarios - solution is relatively simple. We save every assessment detail captured in the table above in a database like MongoDB. Our customers can query this as needed, however they often choose to build a sync process instead, populating a data store that meets their needs better, like 3S. From that point on, they have a data store that can power any analytics solution they need, using any third party tool - if desired.
For real-time scenarios - DynamoGuard core API creates real-time logs at the time of processing the request. These are stdout/stdin logs, also called console logs. This real-time data stream then needs to connect with a stream processor on the customer side. For that connection, we leverage FluentBit, which is configurable both by Dynamo AI and the customer. This enables Dynamo AI to connect with practically all data platforms chosen by customers today, like Splunk or Cloudwatch. How the data is processed past FluentBit is owned by the customer, providing them the flexibility they need not just for monitoring & visualization but also other high stakes processes like risk identification and management.
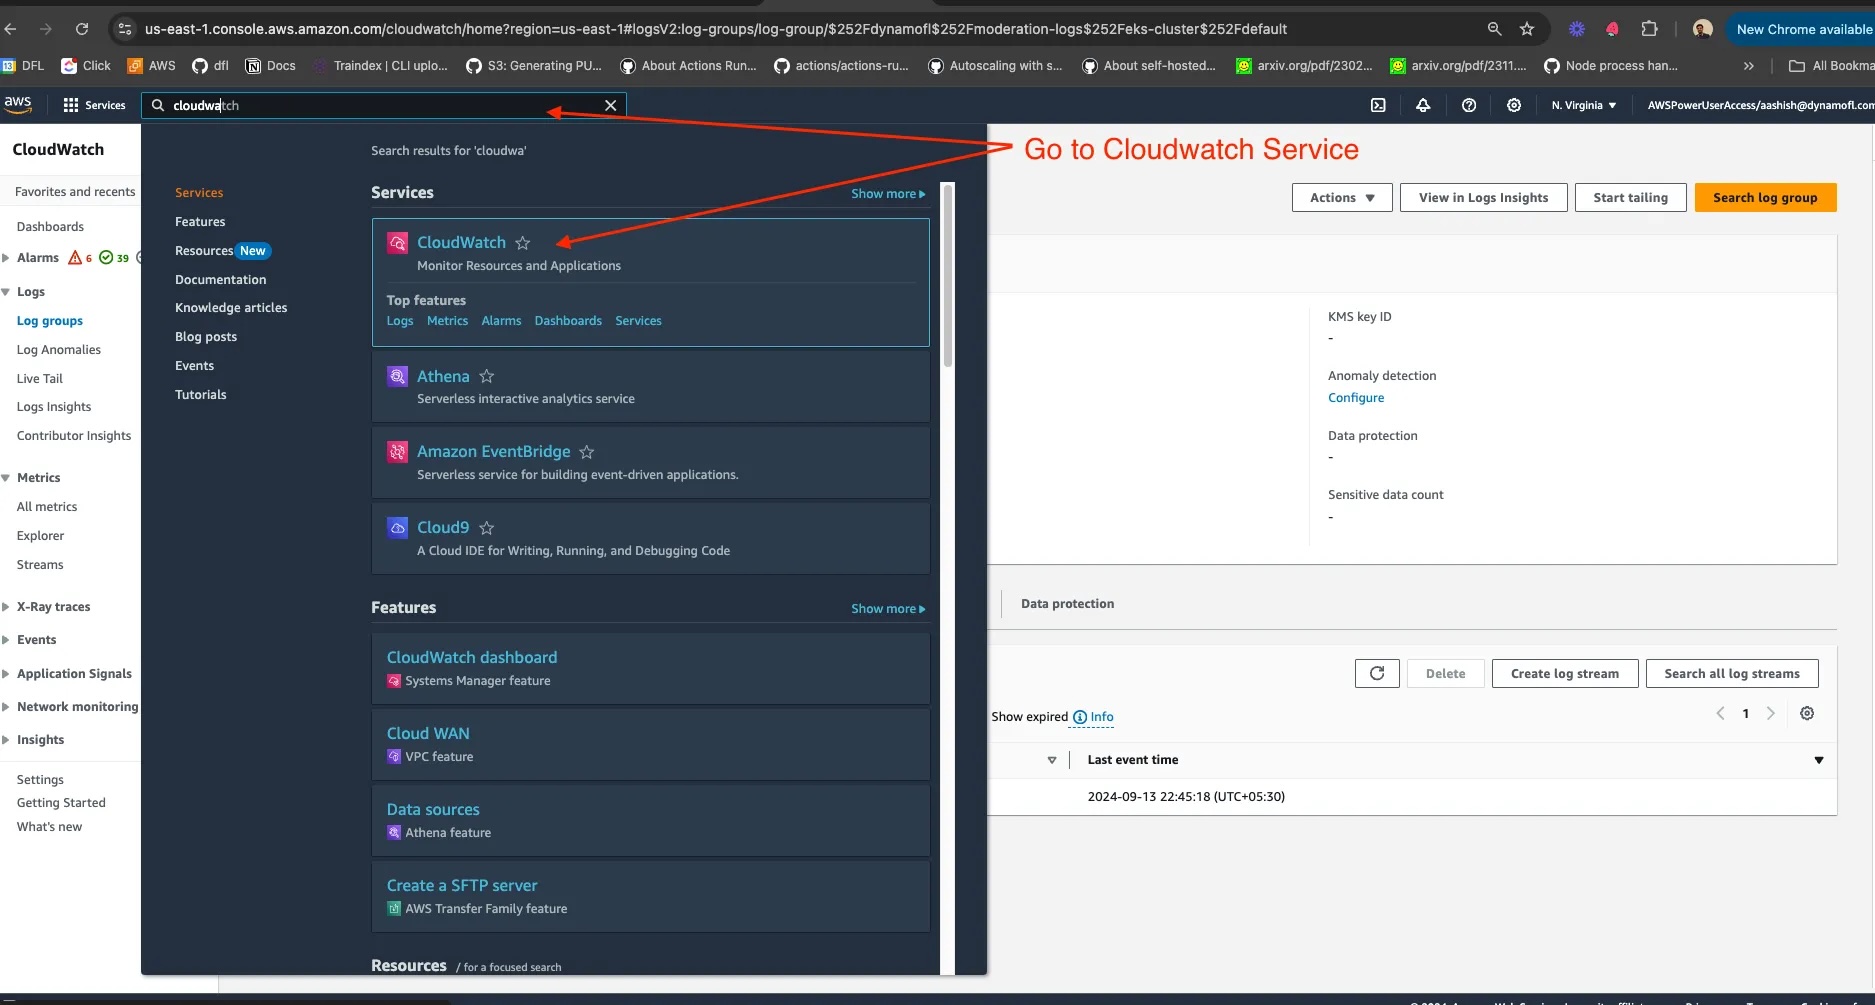
For the next level of detail, let’s assume an instance of DynamoGuard deployment is integrated with AWS Cloudwatch for real-time analysis of events. The flow below walks through the steps to manually monitor the logs and download them. In practice, this is done programmatically, following the path detailed in the paragraph above.
- Search for CloudWatch service in AWS and click on CloudWatch Insights tab on the left panel.
- DynamoGuard publishes moderation logs to /dynamofl/moderation-logs/eks-cluster/default select this group in Cloudwatch Insights.
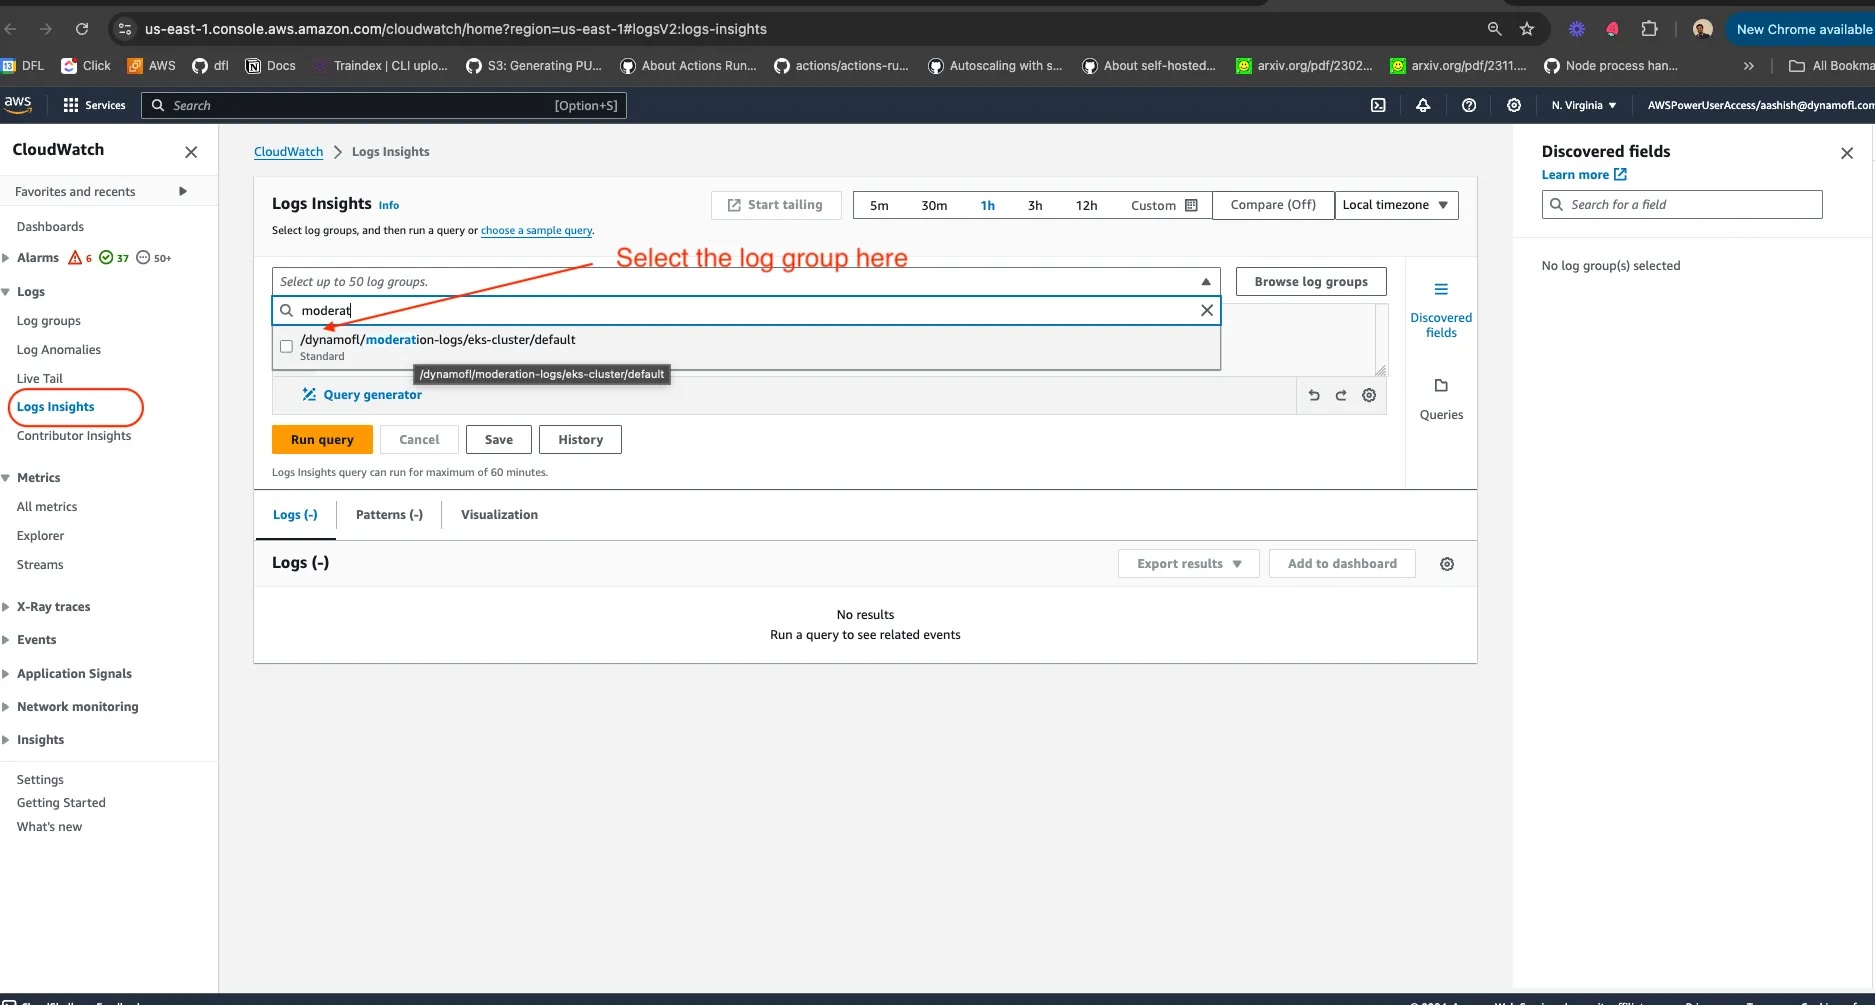
- Now queries can be run using CloudWatch insights interface. The screenshot below shows how to query with a user id.
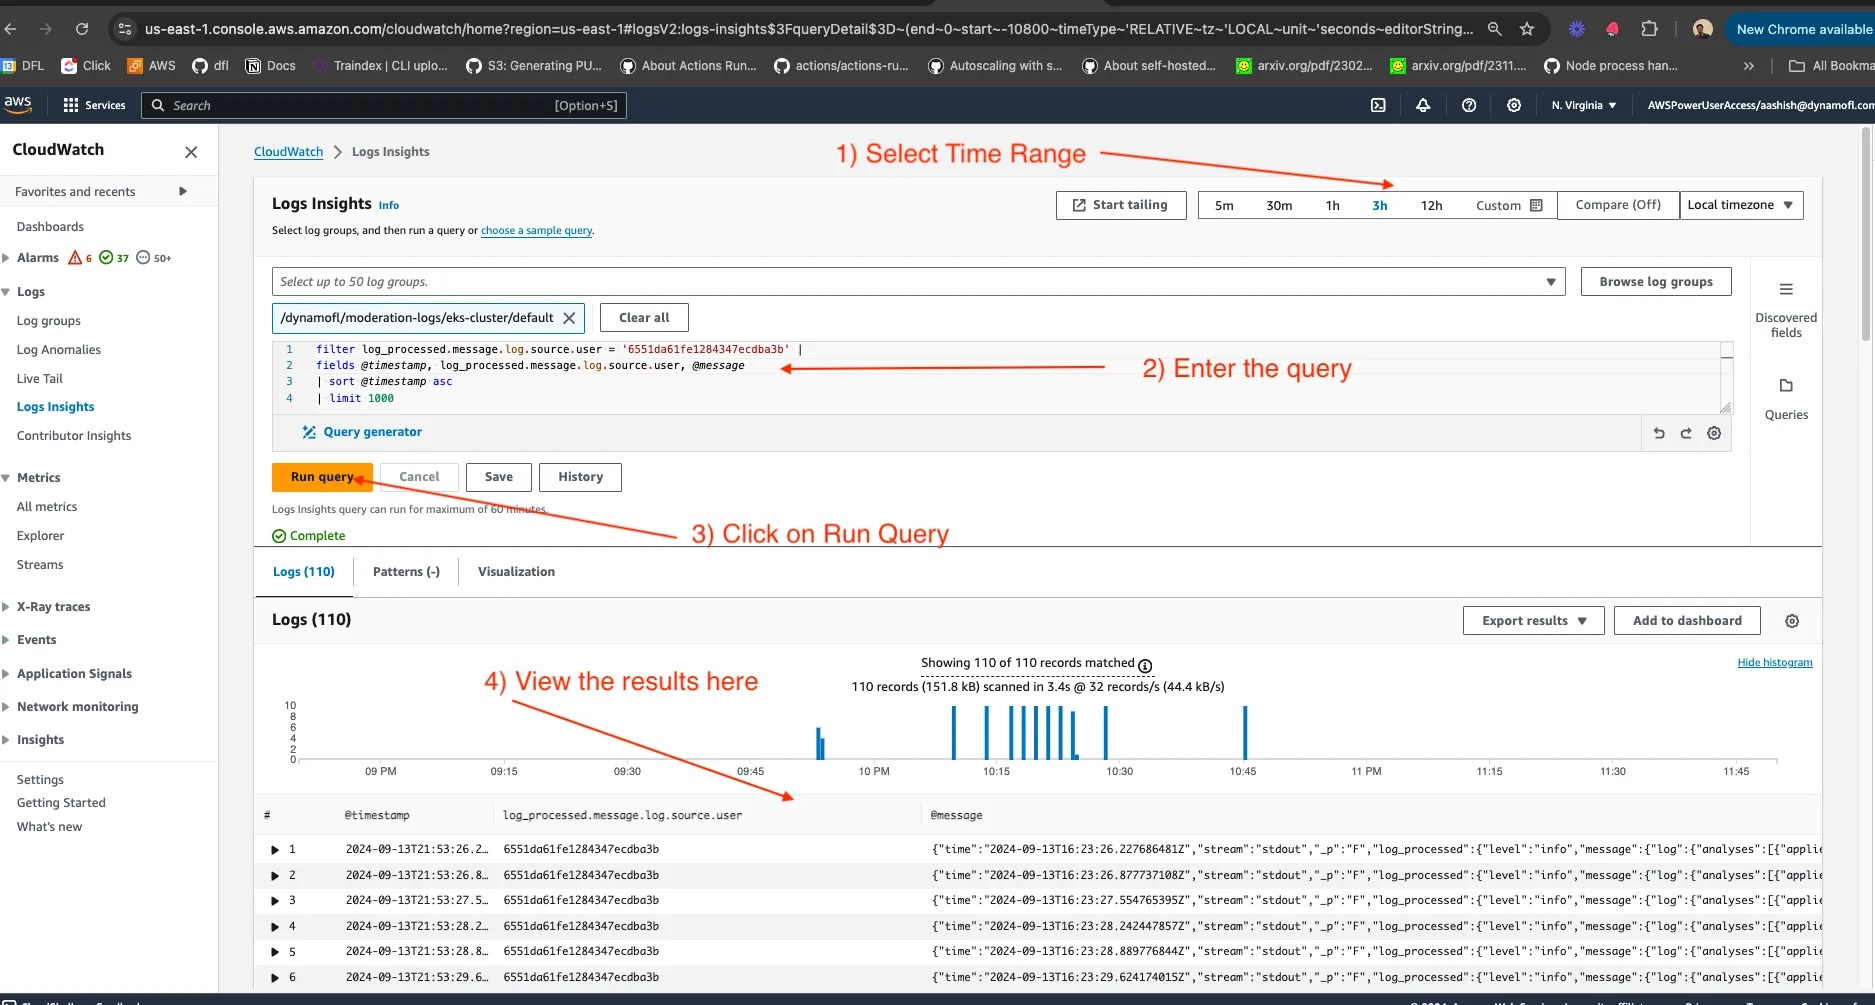
Detailed steps for the visual above is the following -
- Type a query to retrieve the right logs - there are nuances here If your scenario is Chatbot moderation, then the query should look something like the one below.
filter log_processed.message.log.source.user = '<user-id>' | fields @timestamp, log_processed.message.log.chat.prompt,log_processed.message.log.chat.queryId, log_processed.message.log.chat.response, log_processed.message.log.source.model, log_processed.message.log.source.session, log_processed.message.log.source.user, @message | sort @timestamp asc | limit 10000
For simpler use cases, something like this should be good enough.
filter log_processed.message.log.source.user = '<user-id>' | fields @timestamp, @message | sort @timestamp asc | limit 10000
- Choose the time range on the dashboard during which you want to see the logs for the user.
- Replace user id with the id you want to see moderation logs for.
Disclaimer - this is a simplified demo where maximum number of logs returned with a single query will be 10k rows. It is possible to extend this.
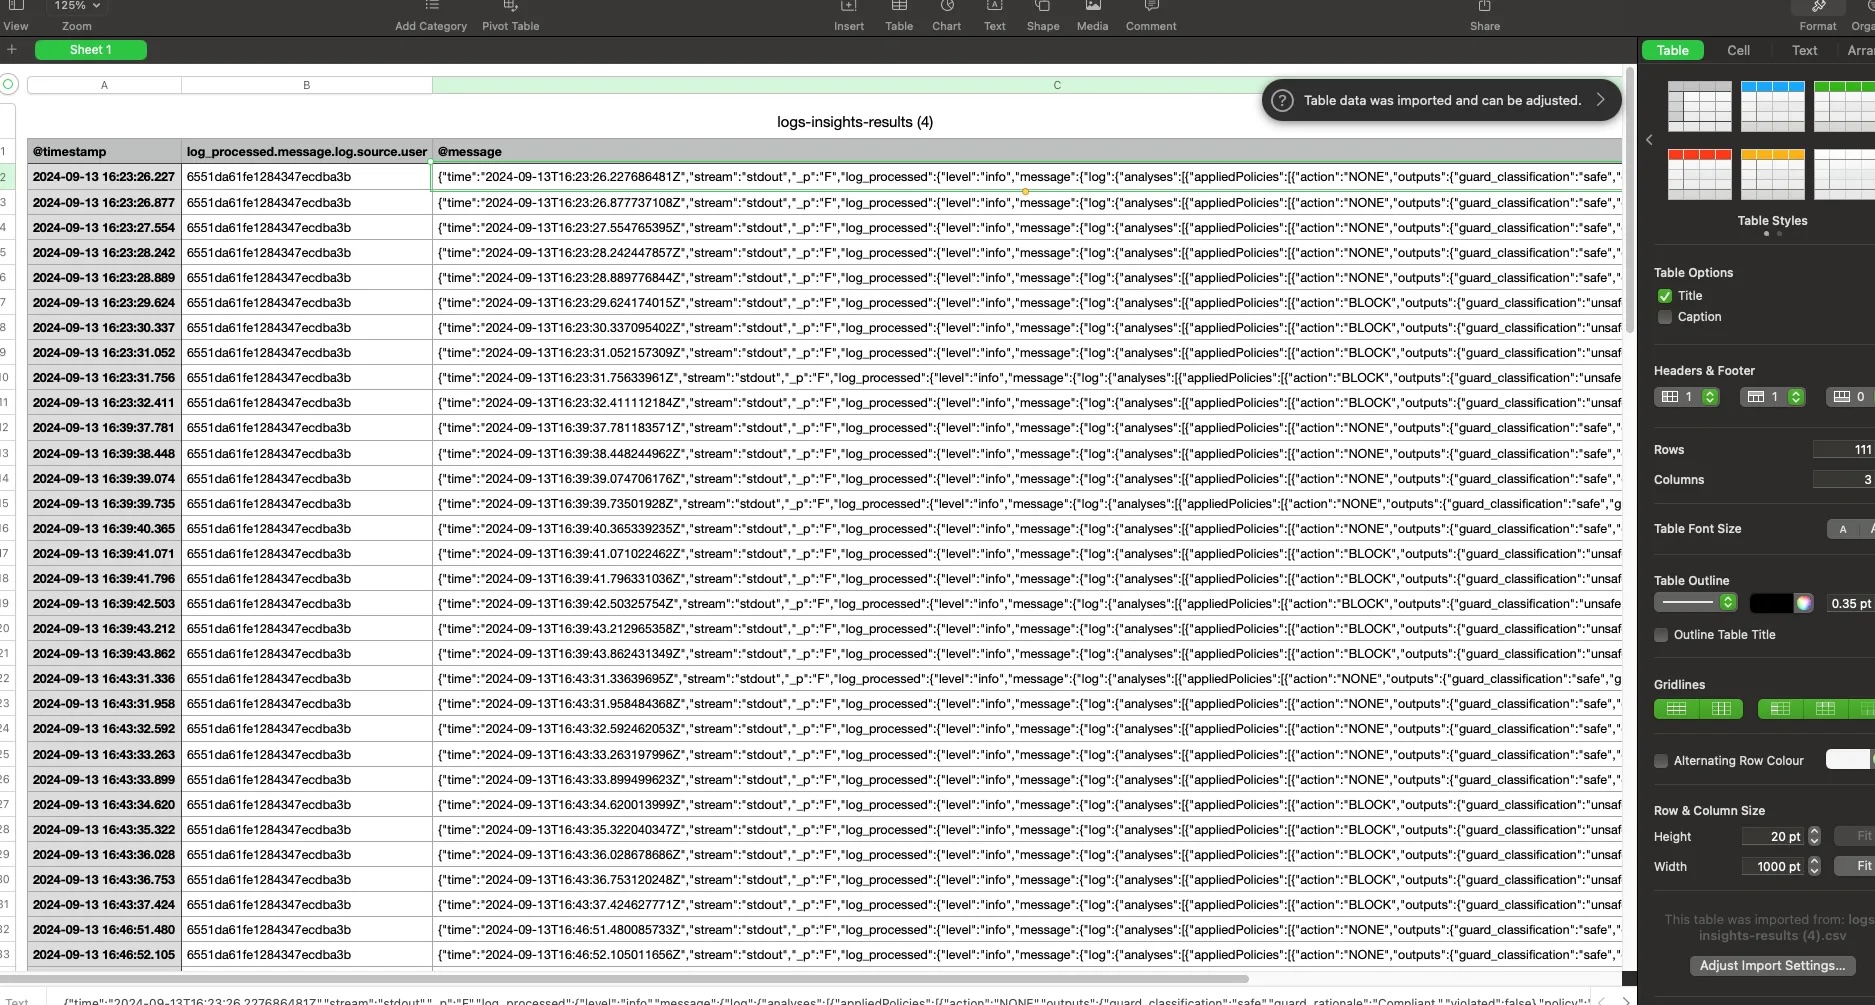
- Click on export results option and choose the format in which you want the logs.
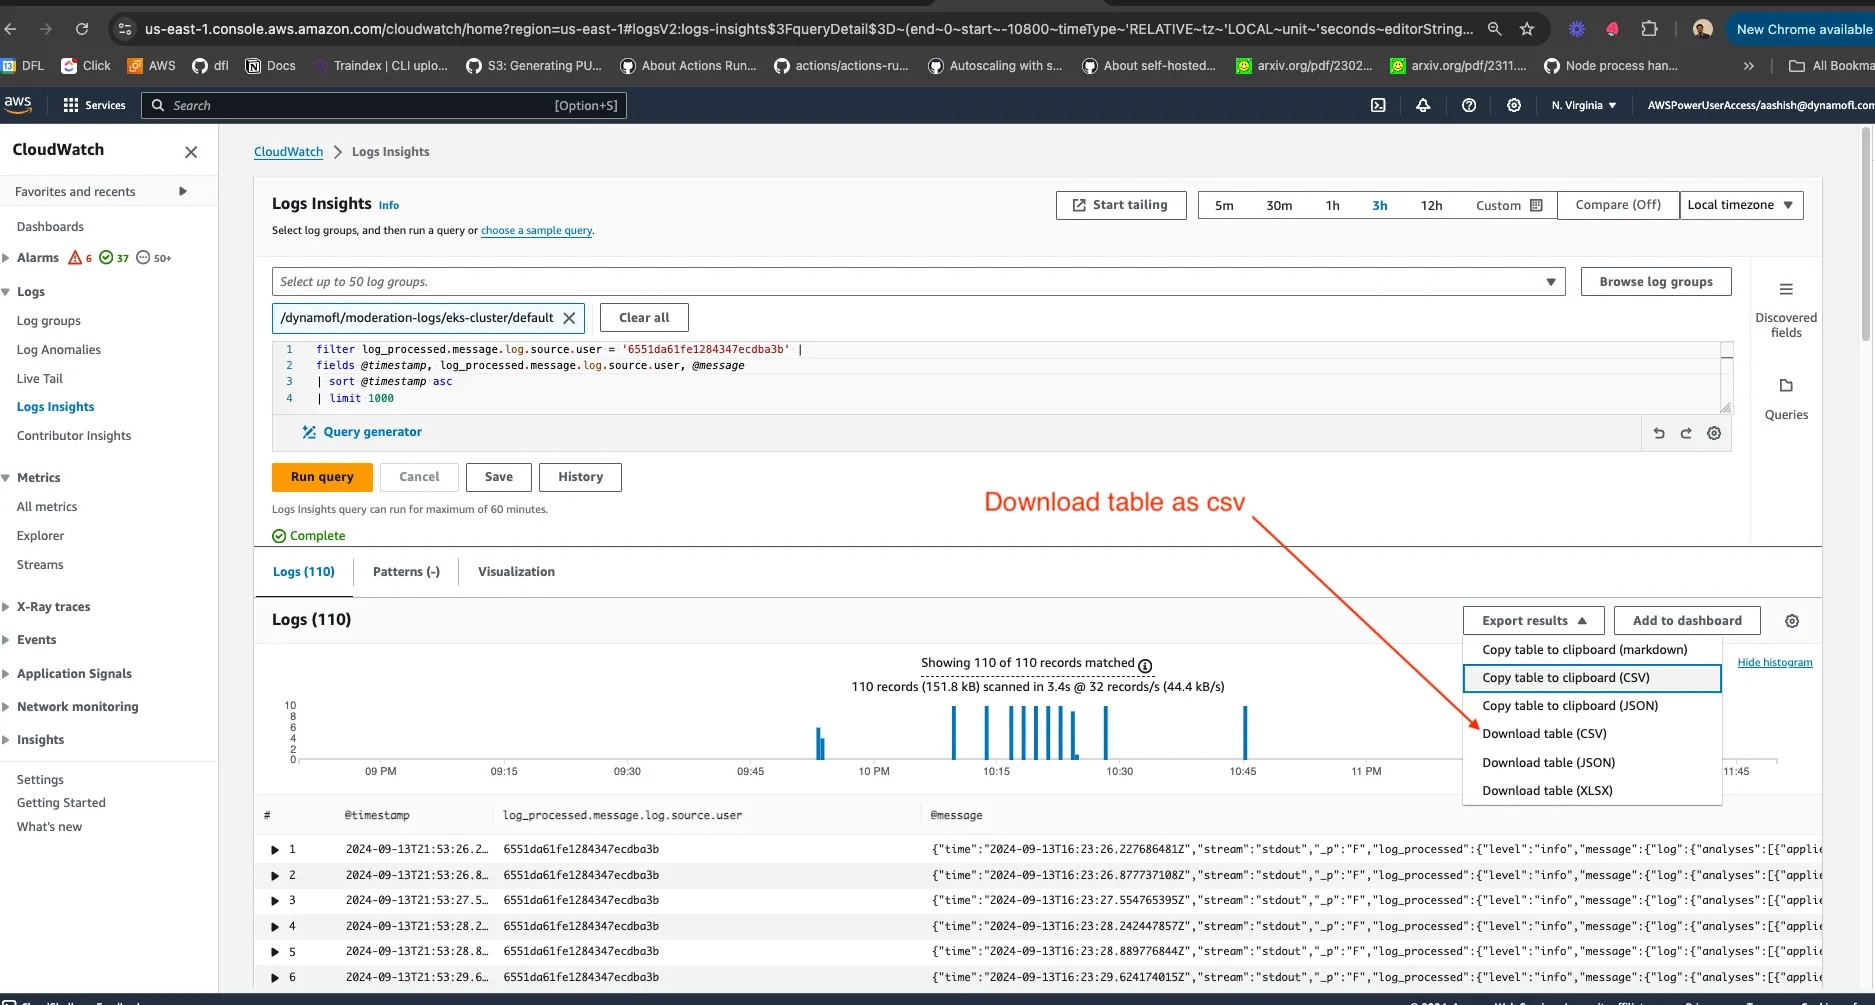
- This is what the CSV looks like
Here are all fields that can be used in customization of the query. These can all be used as filters as well. Dynamo AI team continuously expands these based on customer and business needs.
fields @timestamp, log_processed.message.log.chat.prompt, log_processed.message.log.chat.queryId,log_processed.message.log.chat.response, log_processed.message.log.source.model, log_processed.message.log.source.session, log_processed.message.log.source.user, @message